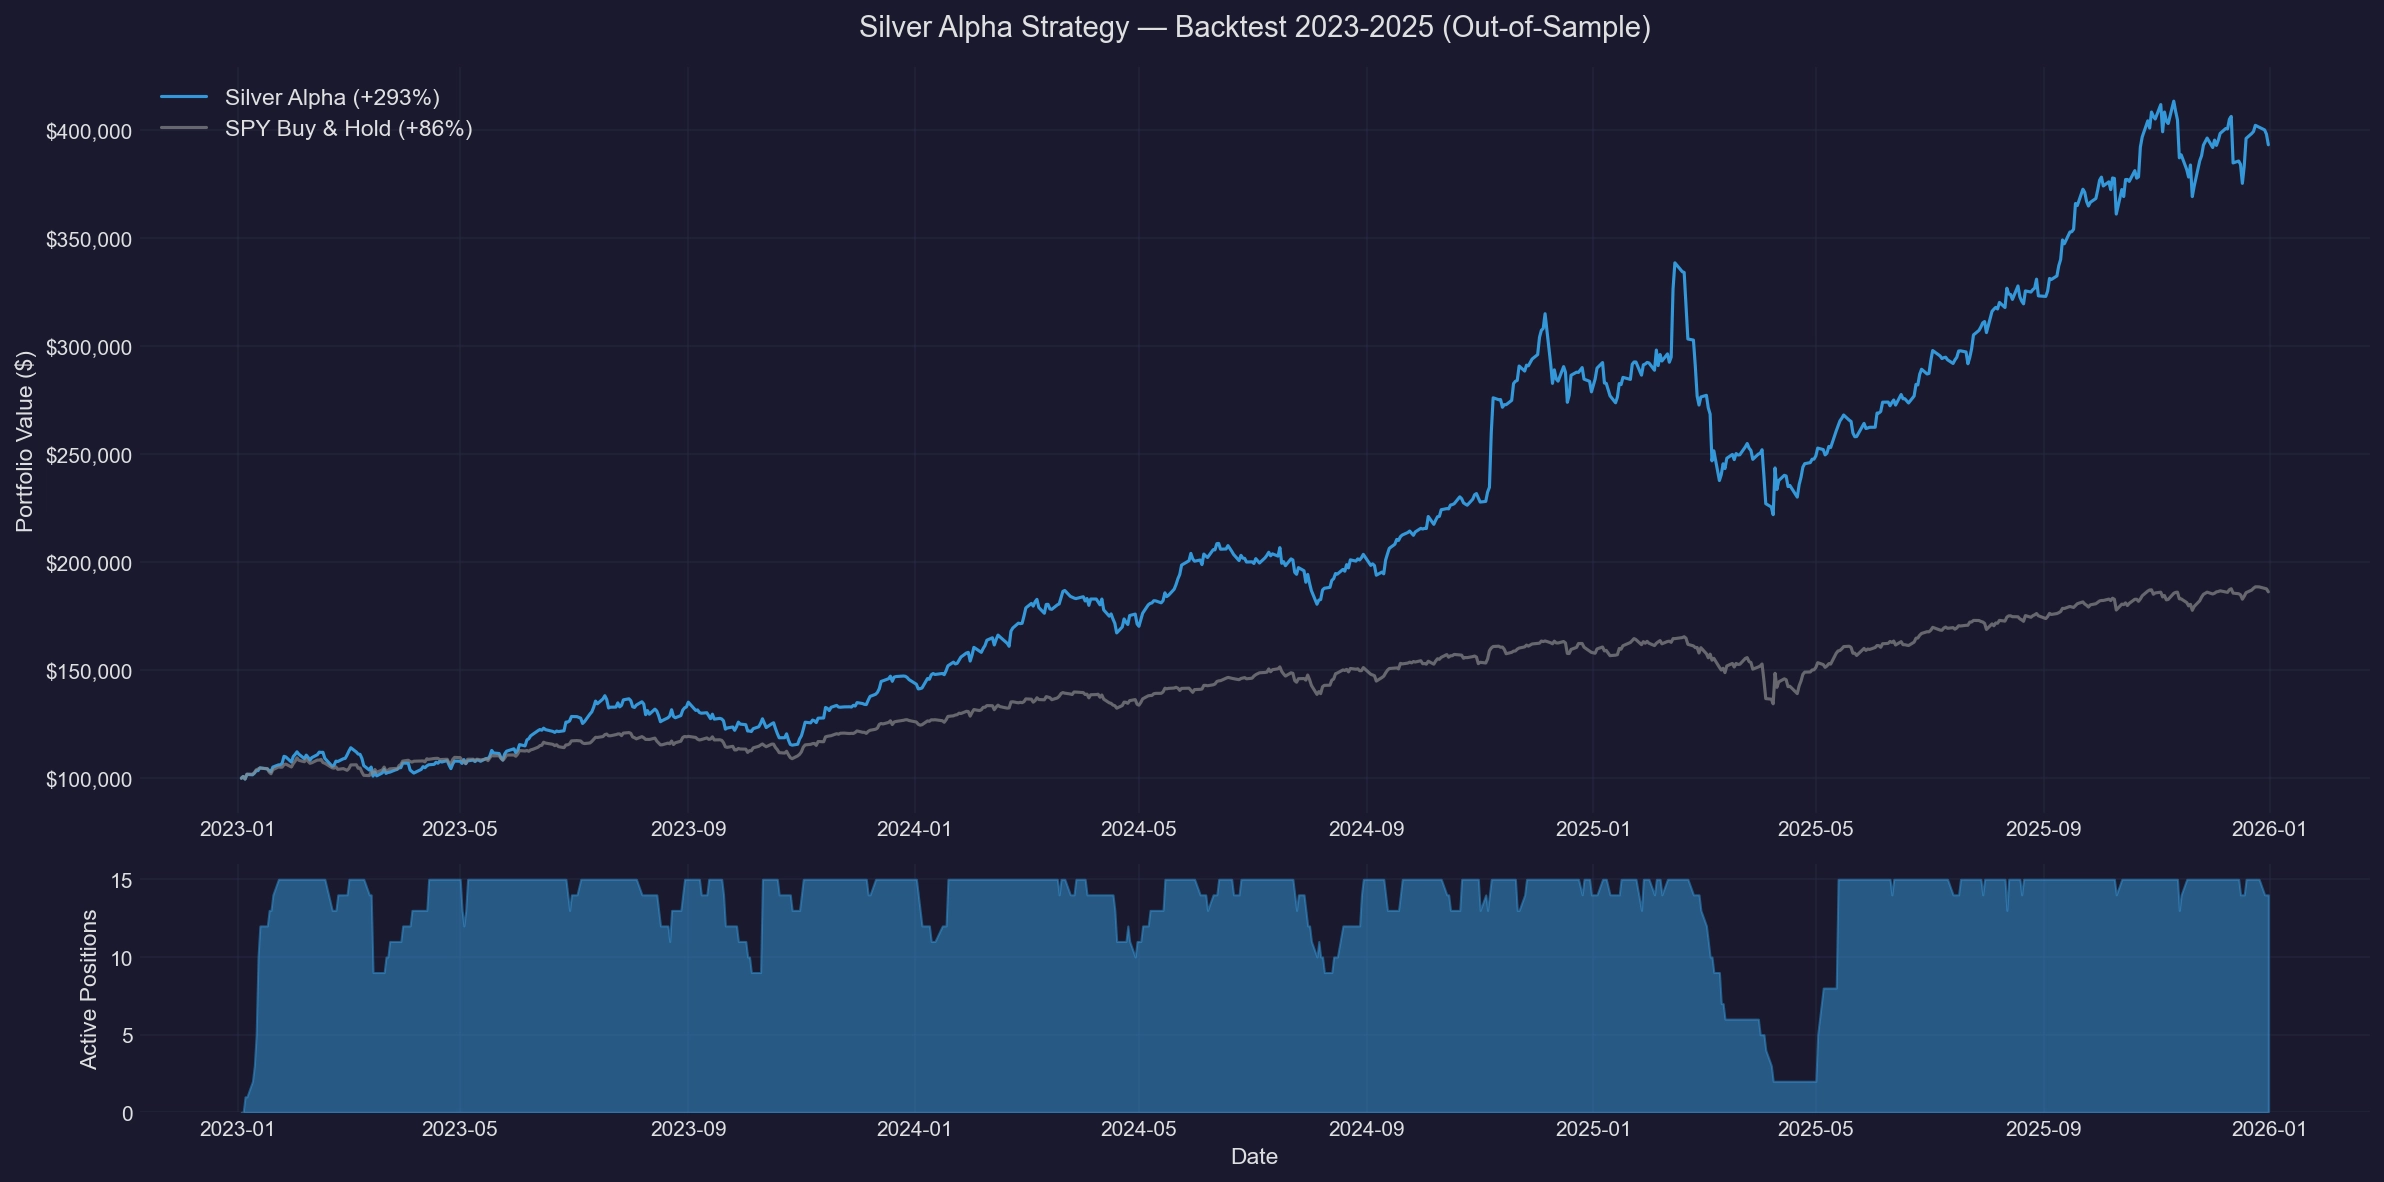
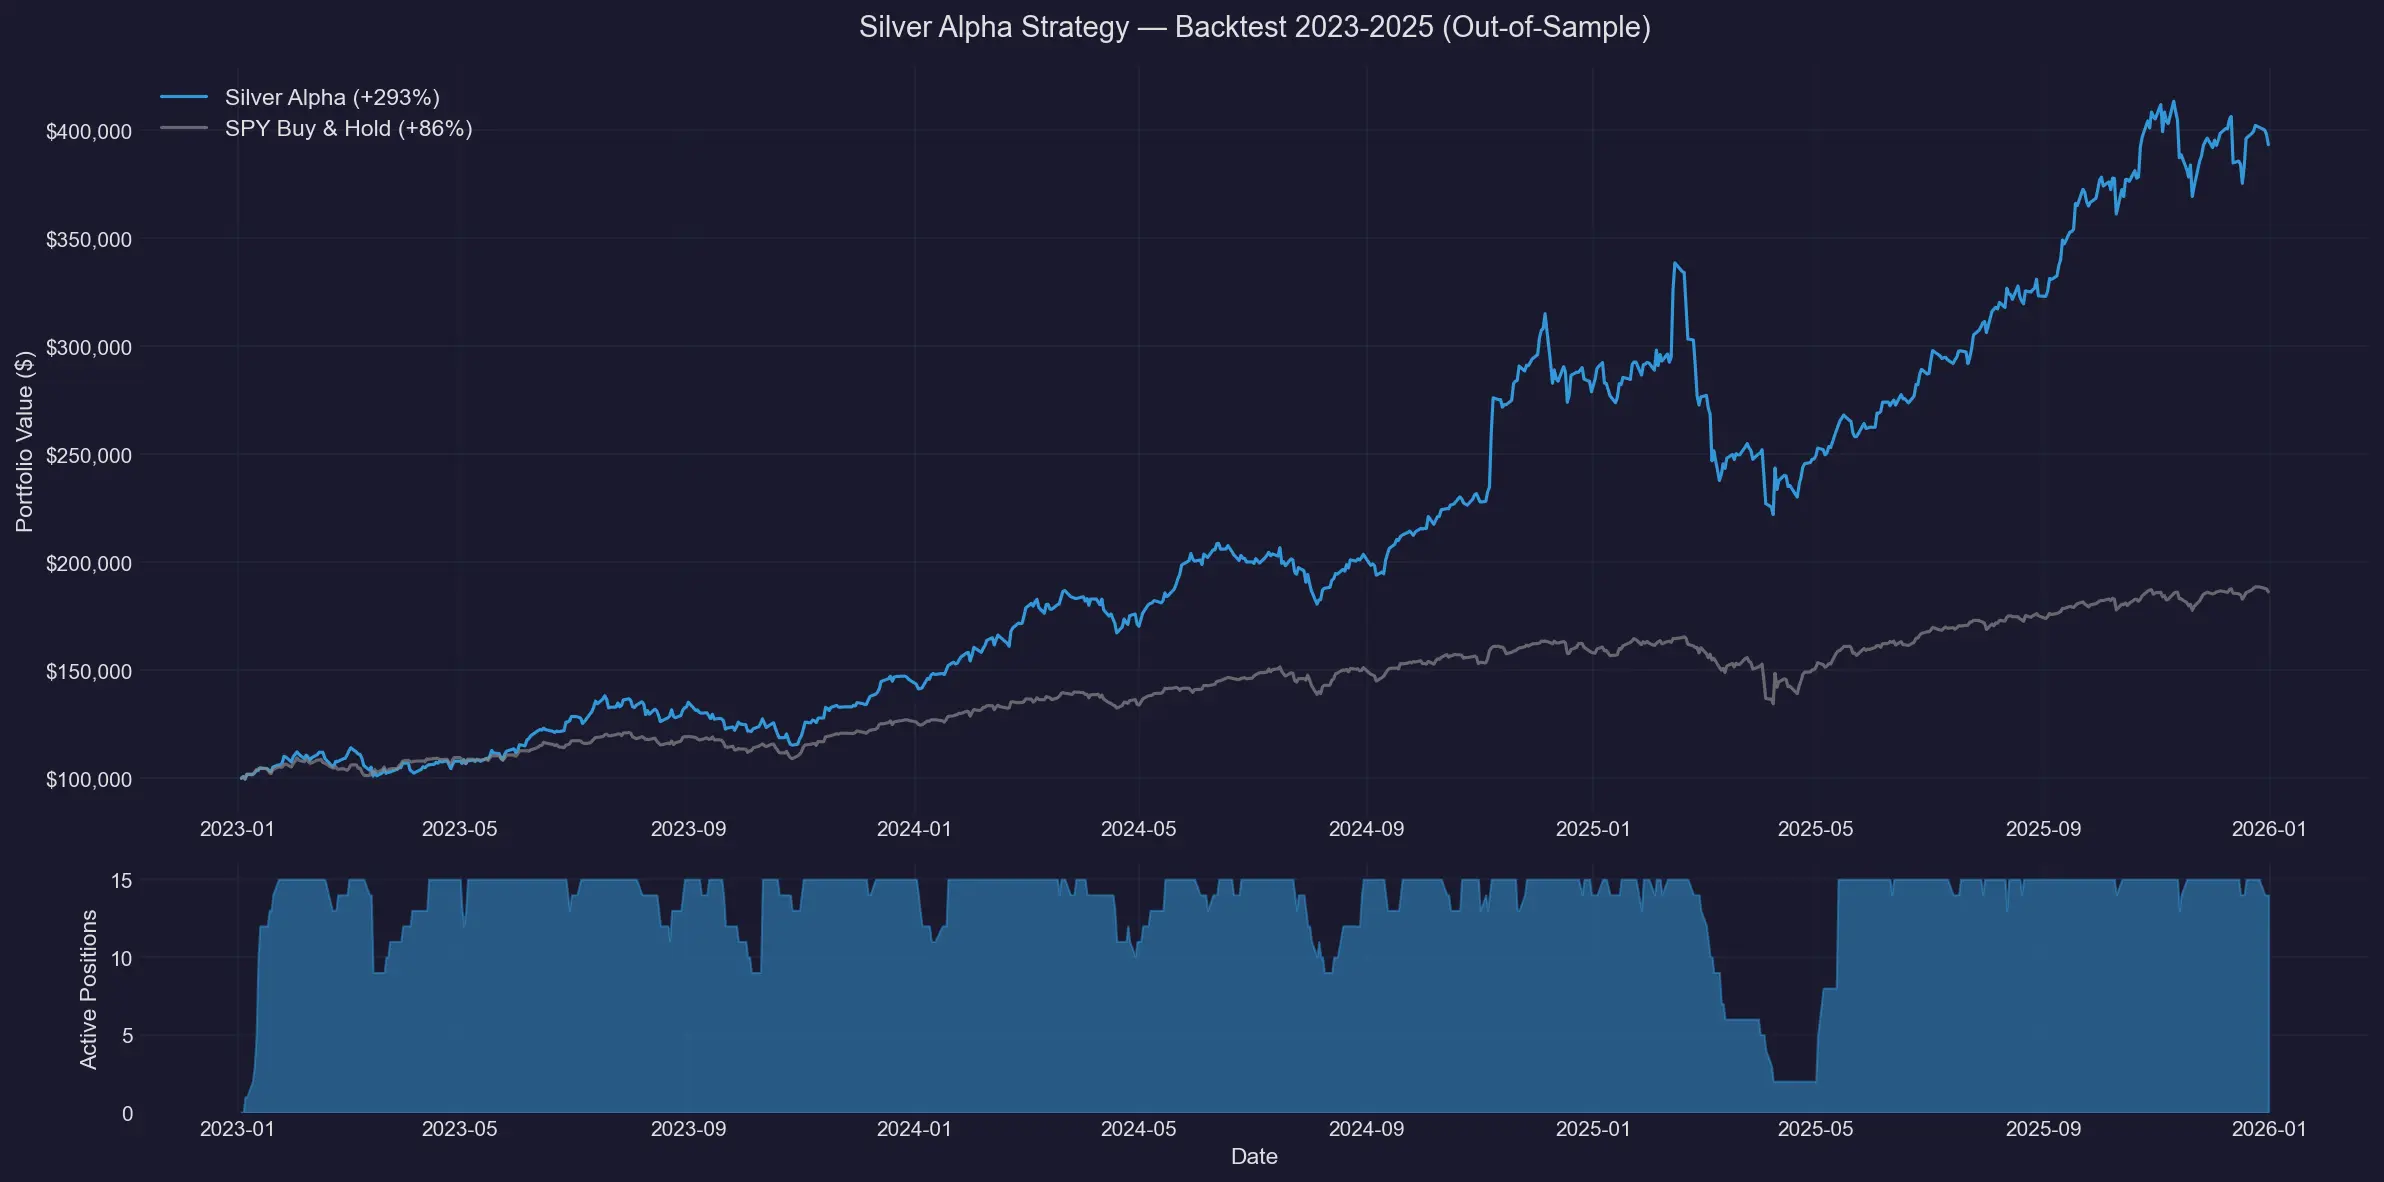
Out-of-Sample Backtest: Silver Alpha Performance
Theory is cheap. The only thing that matters is whether the system works on data it has never seen. Here are the out-of-sample results.
Out-of-Sample Definition
The scoring models were trained on data through December 31, 2022, and fully locked as of that date. The Silver Alpha simulation runs from January 2023 through March 2026 — meaning every trade shown uses signals generated from a frozen model on data it had never seen during training. No hyperparameters, features, or weights were modified during the simulation window.
Signal Quality: Quintile Returns (2020-2026)
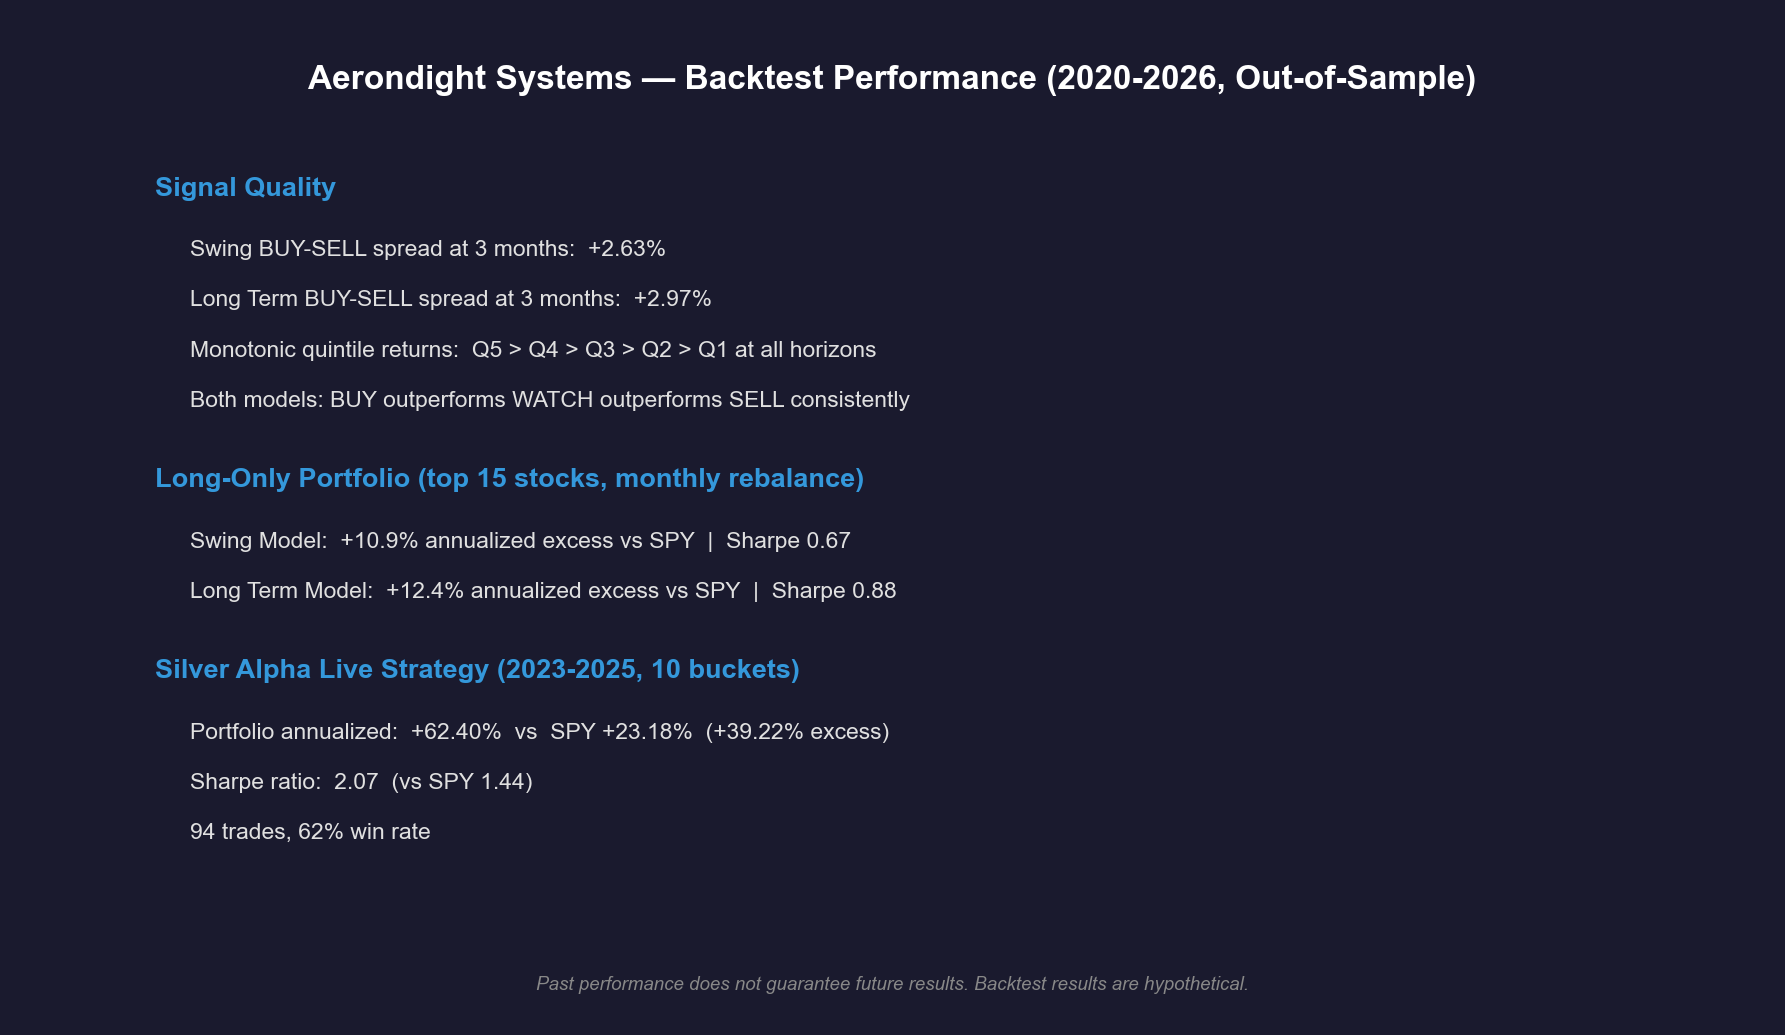
The most important test for any scoring system: do higher-scored stocks actually outperform lower-scored ones?
Aerondight’s scores produce monotonic quintile separation — Q1 (top-scored) stocks consistently outperform Q2, which outperforms Q3, and so on down to Q5. This holds across both the swing trade and long-term models on fully out-of-sample data from 2020 to 2026.
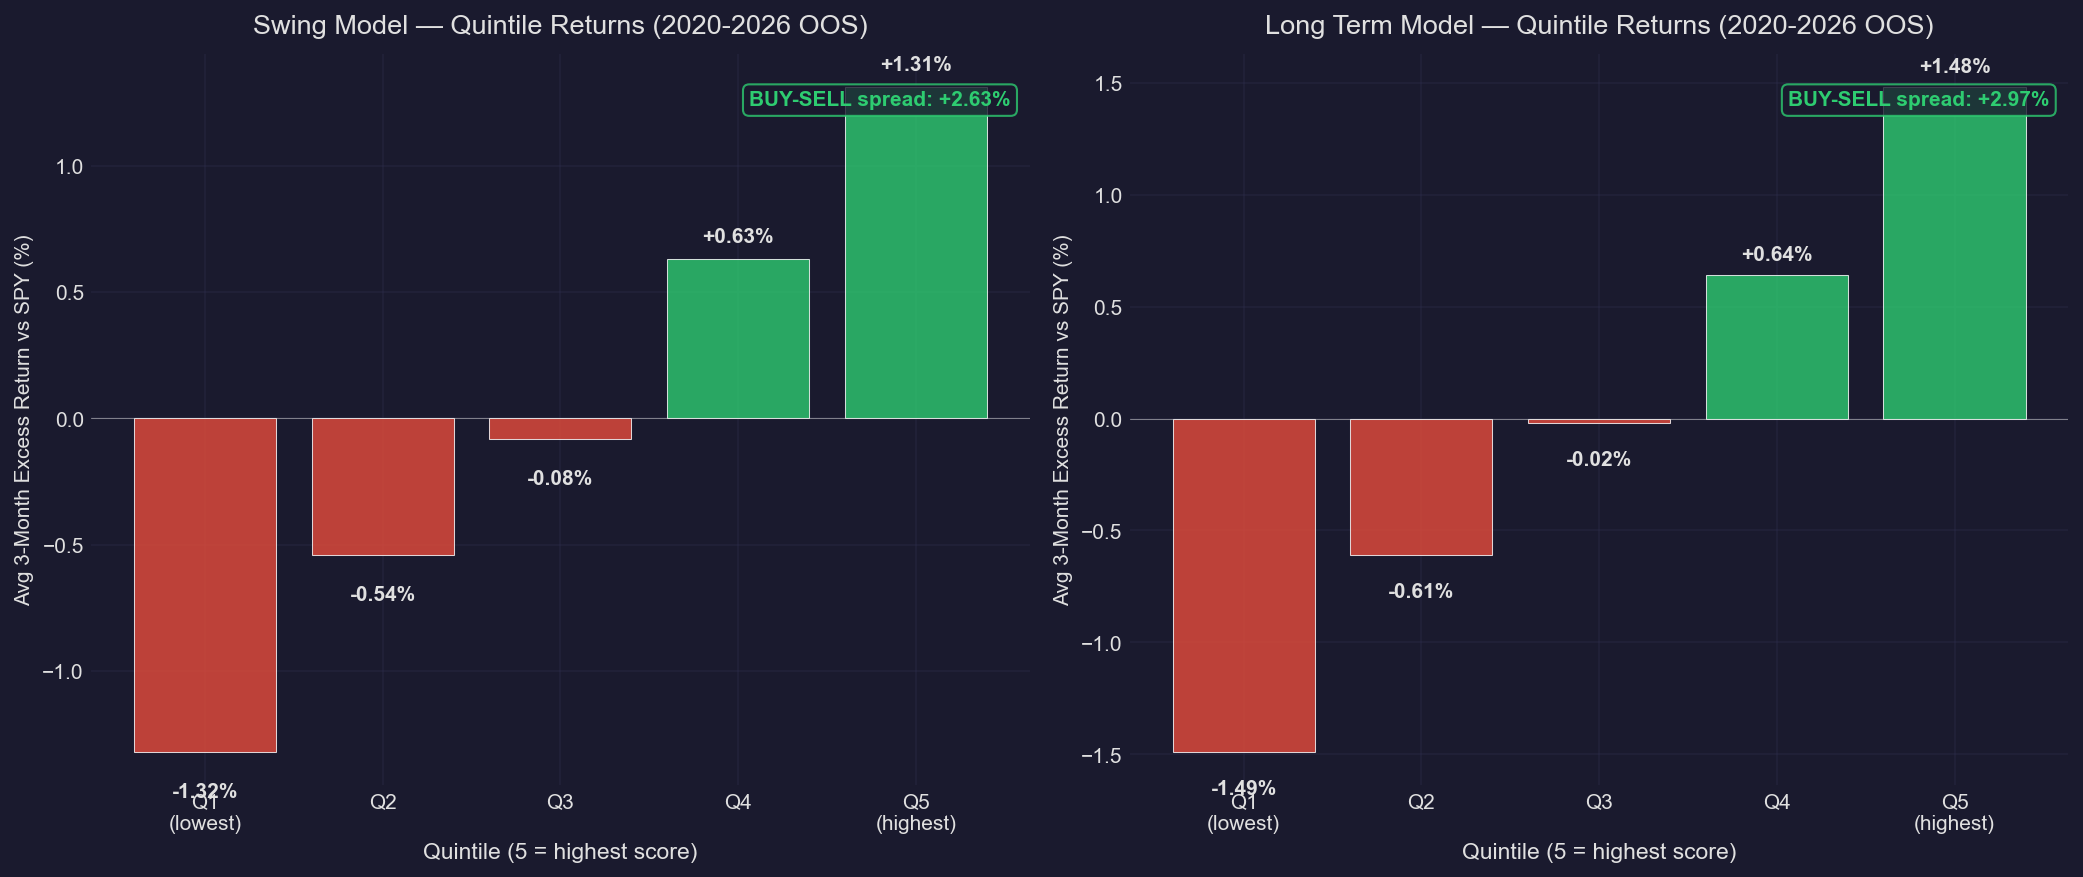
Monotonic separation is the gold standard for factor-based systems. It means the scoring engine isn’t just picking winners — it’s correctly ranking the entire universe.
Silver Alpha: Live Simulation (2023–Q1 2026)
Silver Alpha is a swing trade strategy that uses the scoring engine’s signals for entry and exit. It ran as a paper simulation from January 2023 through March 2026.
Key stats:
- 94 completed trades
- 62% win rate
- +325% portfolio return (vs SPY +86.28%)
- 16.42% average return per trade (+10.65% avg excess vs SPY)
- Sharpe Ratio: 2.07 (vs SPY 1.44)
- Max Drawdown: -26.49% (vs SPY -18.76%)
- 73 days average holding period
- Fully systematic — no discretionary overrides
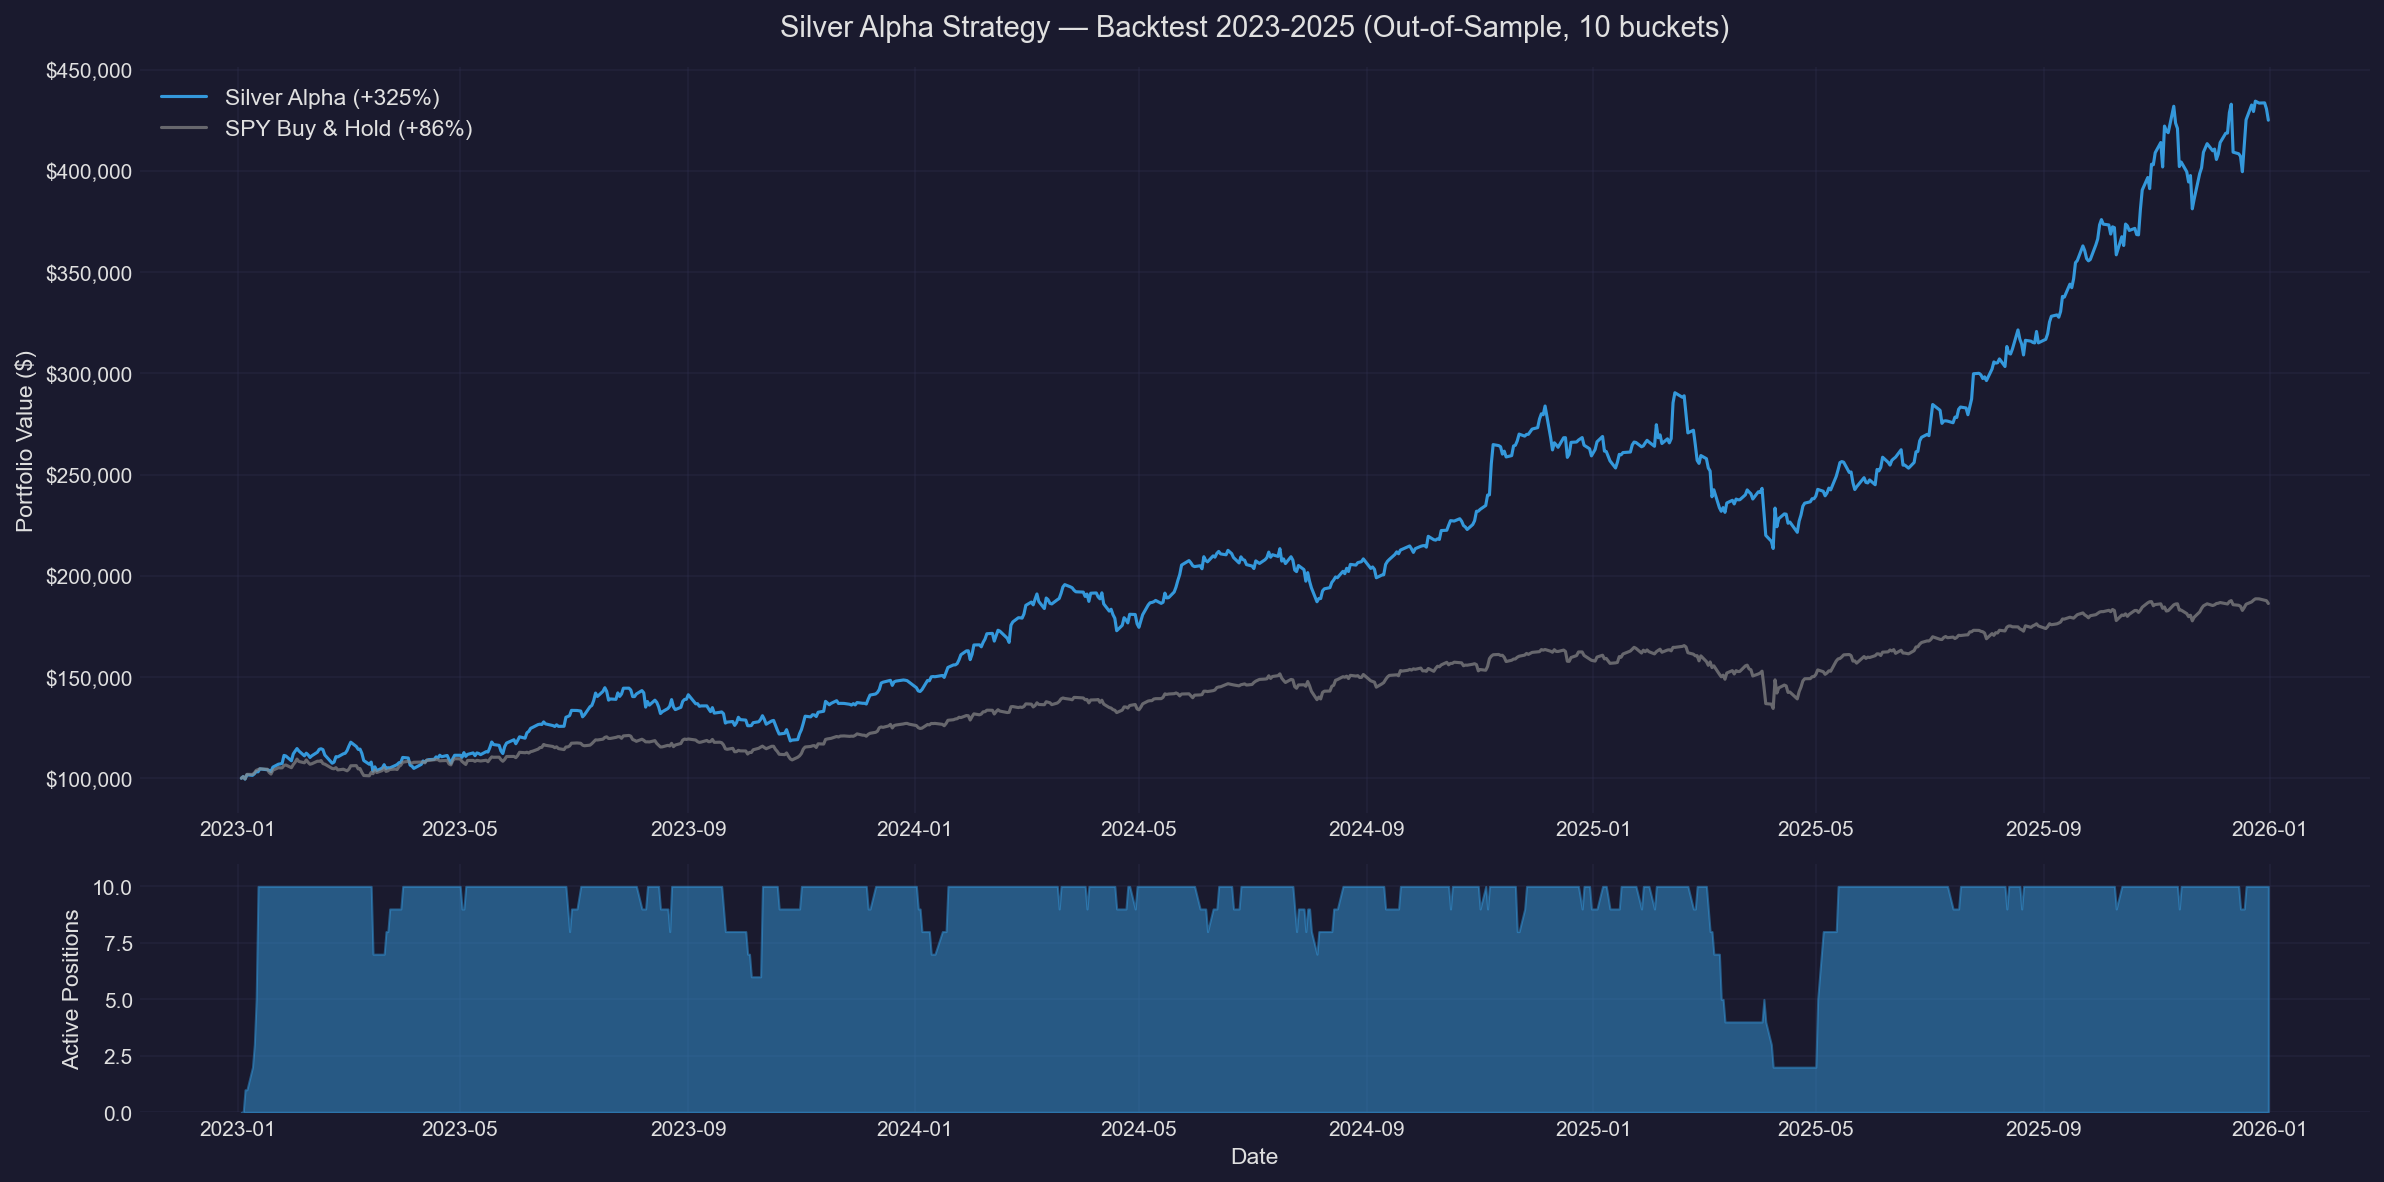
The full trade log (all 94 trades with entry/exit dates, prices, returns, and exit reasons) is available for download: silver_alpha_trades_2023_2025.csv.
Performance Summary
What’s Not Shown
Portfolio simulation methodology. The equity curve reflects a 10-bucket portfolio: up to 10 concurrent positions, each bucket independently holds either a single stock or SPY. When a stock triggers a SELL signal, the bucket rotates into SPY; when a new BUY signal appears, the bucket sells SPY and buys the stock. This keeps capital fully deployed at all times and provides a clean benchmark-relative comparison.
Survivorship bias (partial). The ~900-name universe is composed of current S&P 500 and S&P 400 MidCap members, refreshed annually at year-end. Intra-year index changes are not reflected, meaning a stock added or removed mid-year could introduce minor survivorship effects. I’ve manually removed some of the most obvious cases, but the log still carries some residual bias. Future versions will use point-in-time index membership.
Fundamental data is point-in-time. All fundamental inputs to the scoring engine use as-of-record-date values — no look-ahead bias. A trade on 2024-03-15 only sees fundamentals filed before that date.
What’s still not modeled: slippage, transaction costs, borrow costs for any short exposure, and realistic market-impact assumptions. The simulation reflects signal quality at execution, not a fully deployed portfolio’s net returns.
The trade log is fully transparent: every entry, every exit, every reason. No cherry-picking.
← Back to research